Scaling and the Totalview Reports
While it is generally recommended to use the Totalview Reports at 100% for optimum display results, the following scaling factors are also supported: 120%, 125%, 150%. Other scaling factors are not supported, as the visual results can be unpredictable and impact the usability of the application negatively.
Below we provide examples of different scaling factors, as well as exemplify problematic issues when choosing them.
Please note that all scenarios were tested with a monitor resolution of 1920×1080. For other resolutions, the scaling recommendations below may vary.
100% Scaling (Recommended)
At 100%, the Totalview Reports will be displayed optimally on the screen, as all elements and text will be shown correctly.
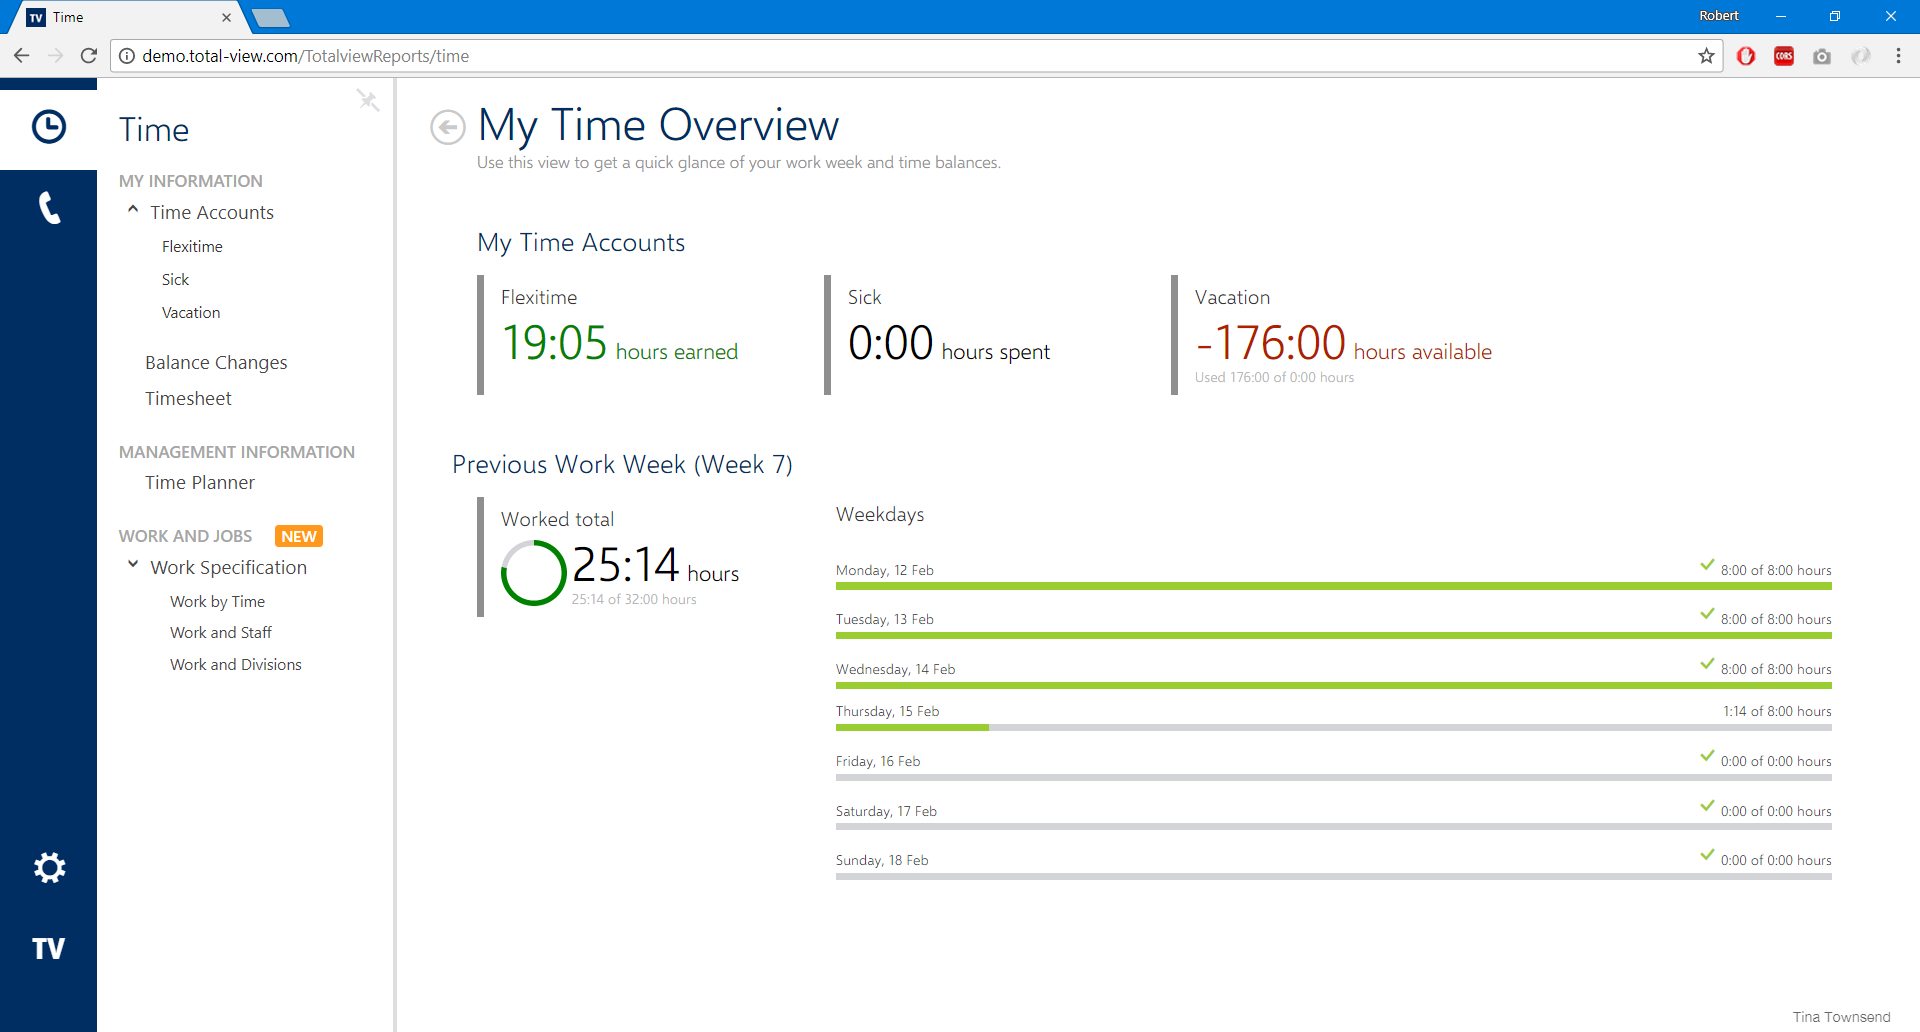
120% Scaling (Supported)
The Totalview Reports can be used with a display scaling at 120%, as all elements have sufficient space and are shown properly.
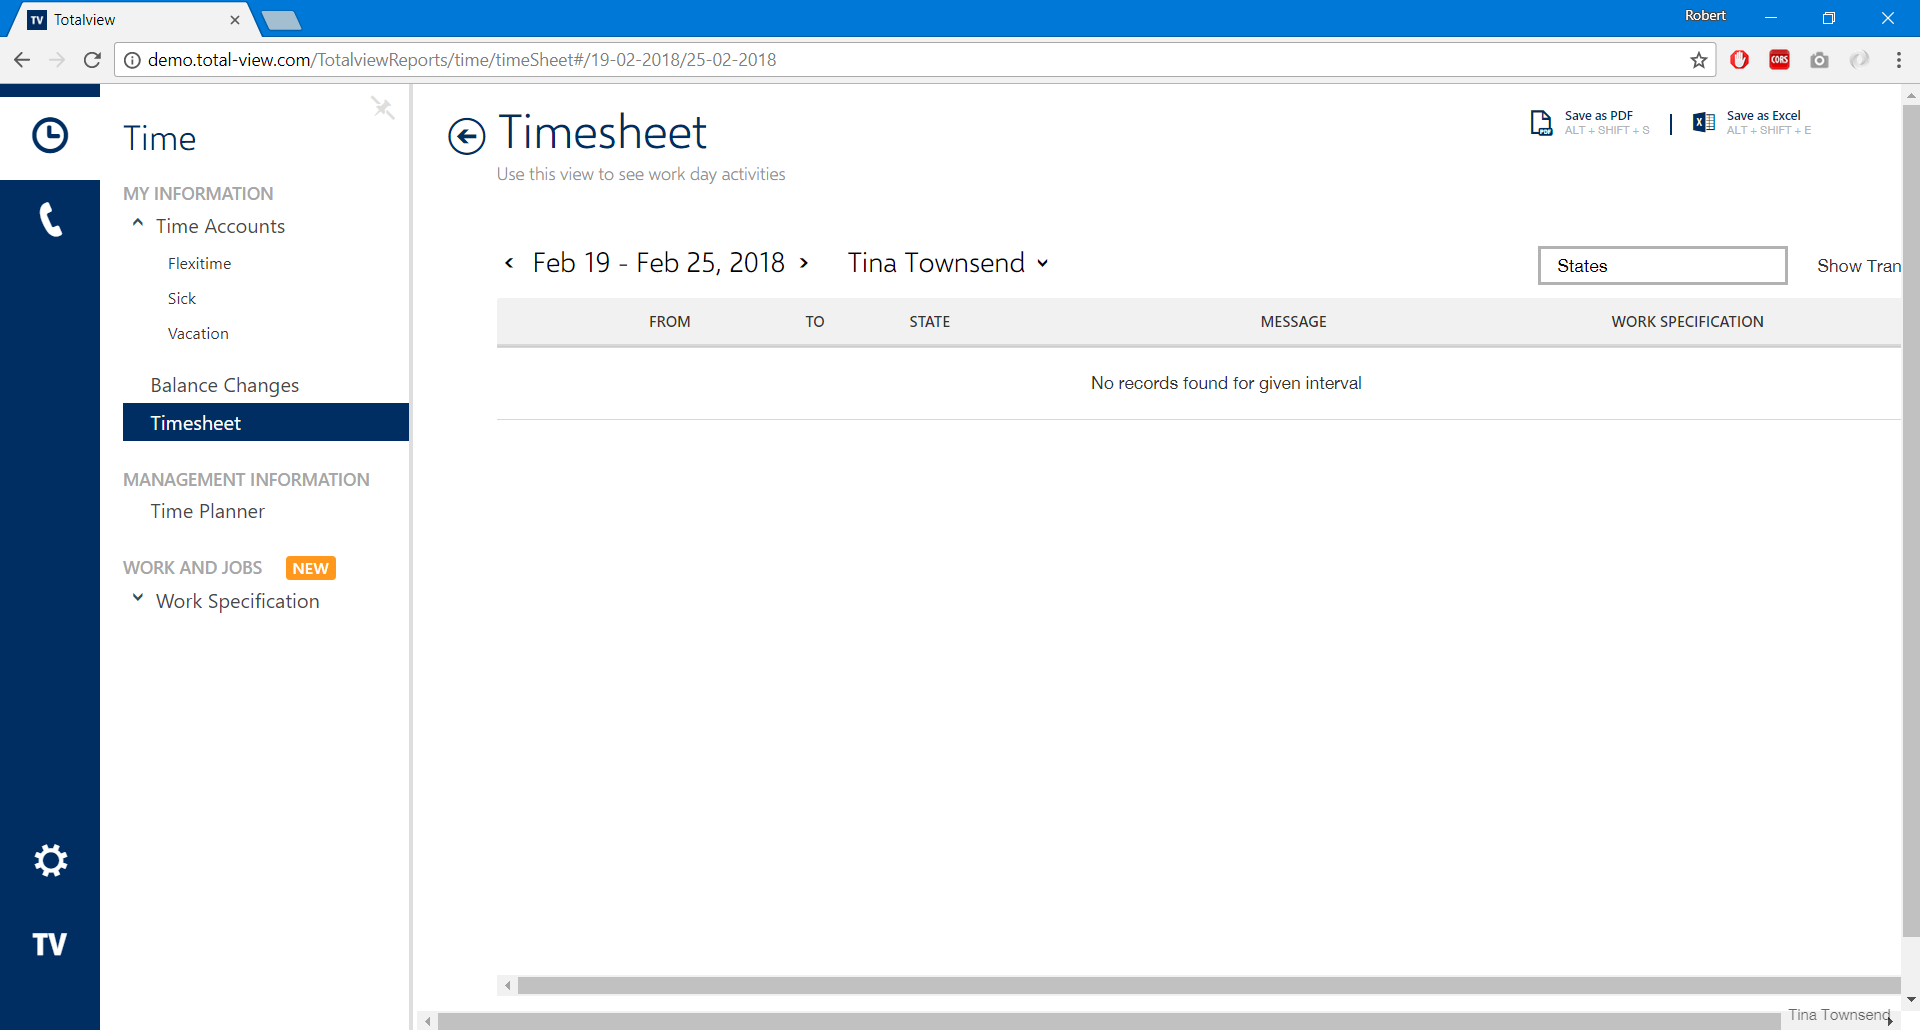
125% Scaling (Supported)
At 125%, the Totalview Reports behave normally, while it is possible that extra scrollbars may appear, as shown in the example below. This issue, however, can be remedied by collapsing the menubar to the left.
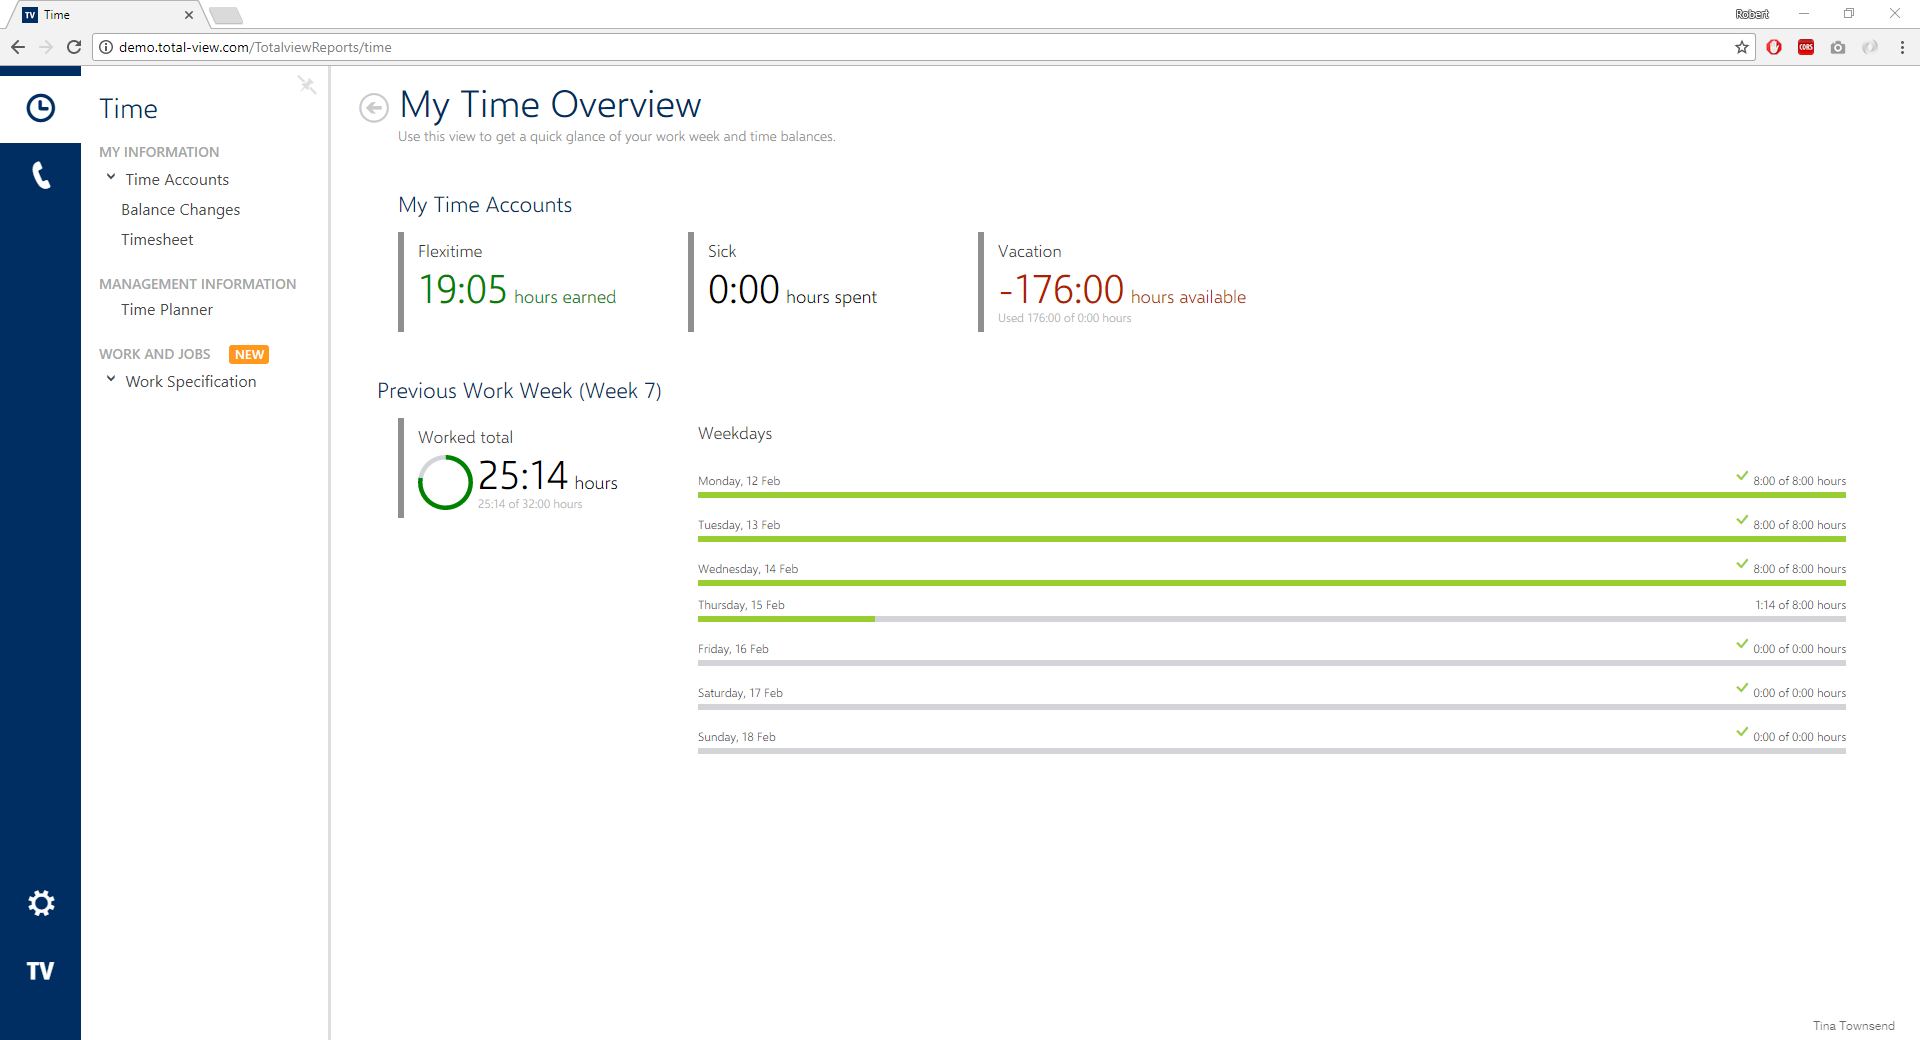
150% Scaling (Supported)
At 150%, the Totalview Reports are usable. However the amount of space available for the elements on the page is highly reduced.

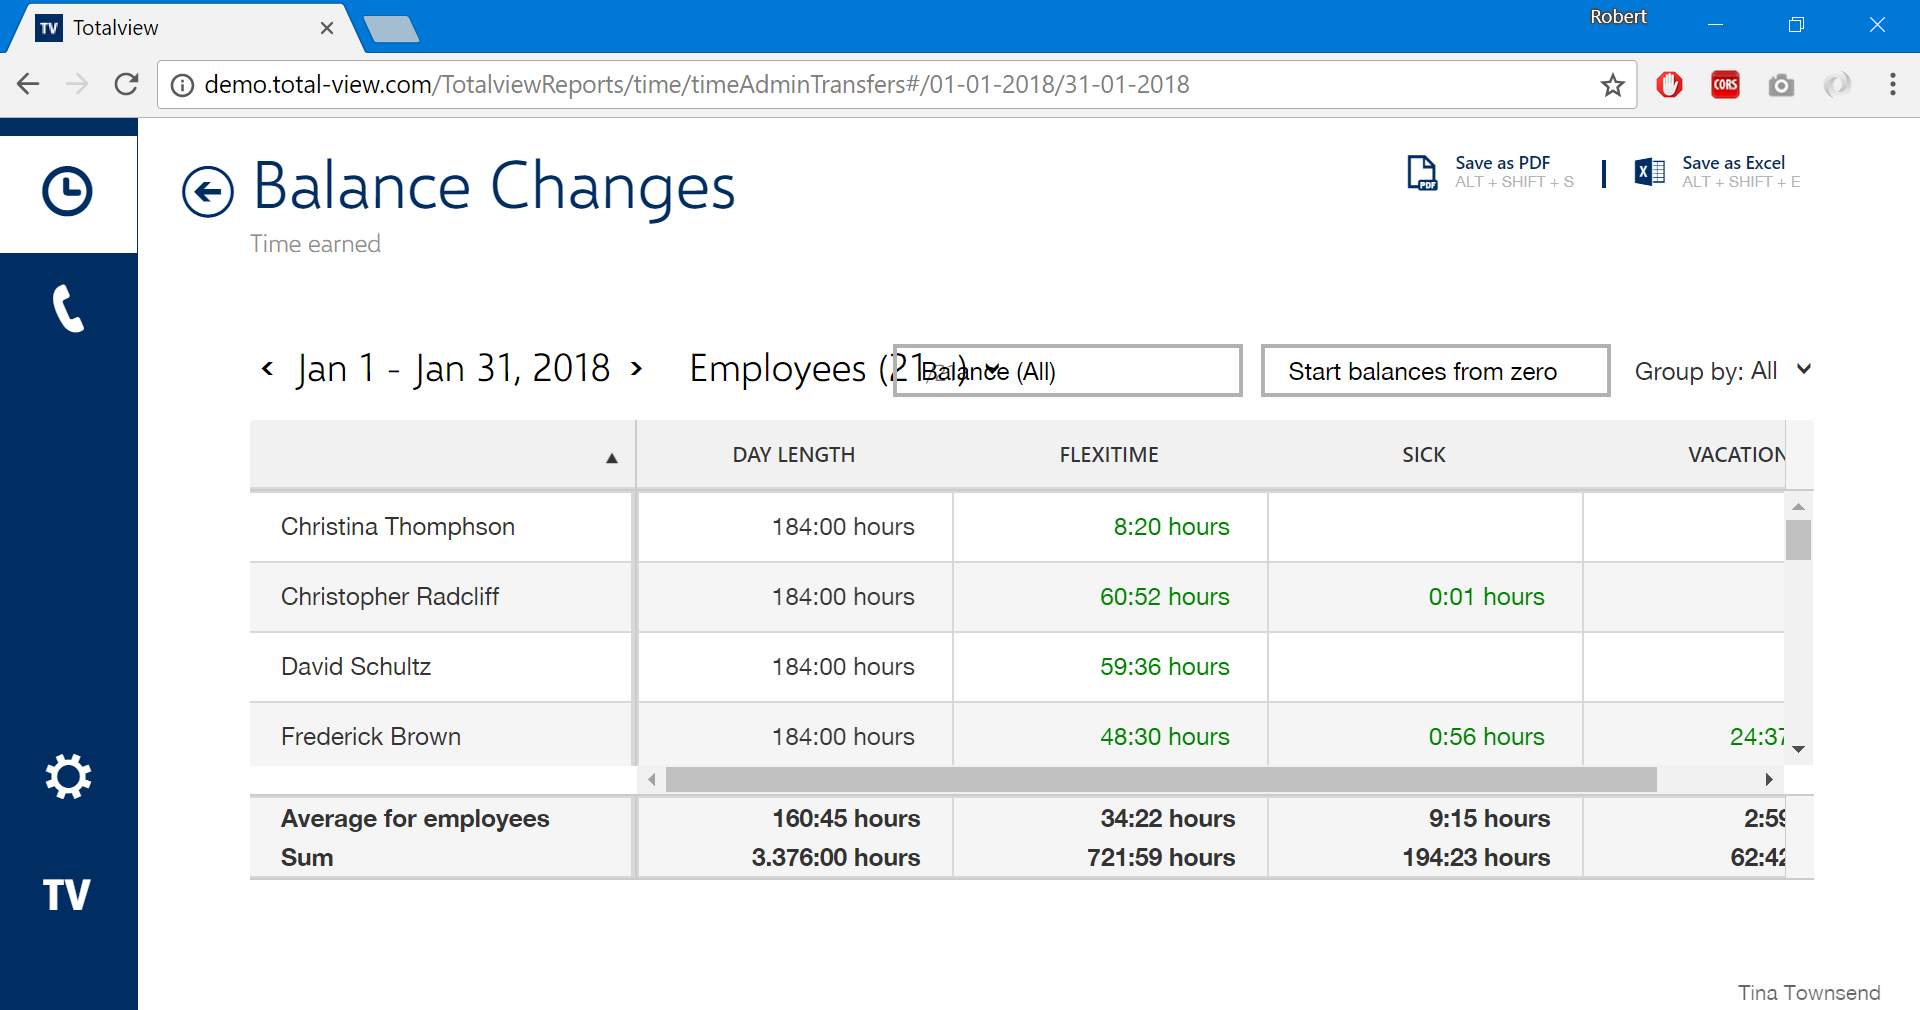
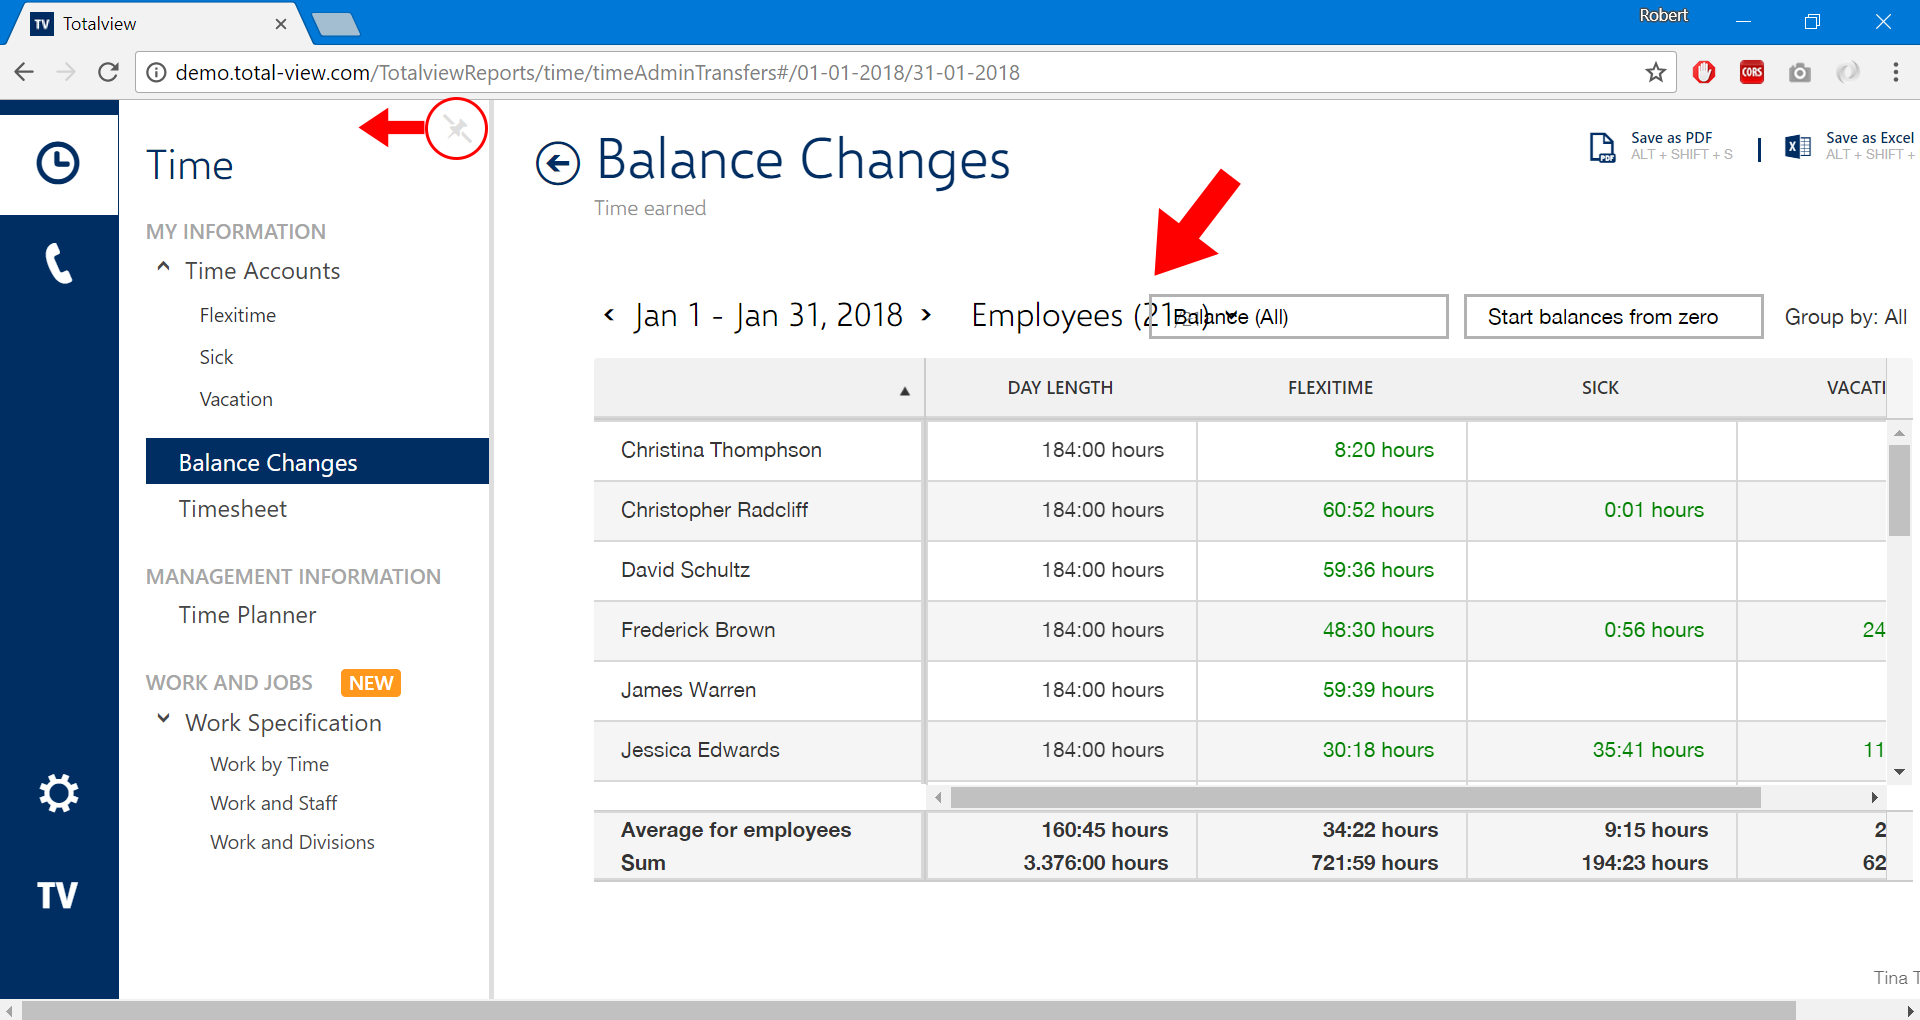
With a scaling factor of 150% it is highly advisable to have the menubar to the left collapsed. Otherwise, users might run into the problems of elements overlapping, as shown below:
175% Scaling (Not supported)
Using the Totalview Reports at a 175% scaling is discouraged, as the avaialble space for all elements becomes too small, potentially allowing for overlaps: