Call Codes
The Call Codes report section in Totalview provides insights into which reason codes and outcome codes are assigned to calls.
These statistics can help users understand user behavior, assess the effectiveness of call handling, and identify trends across departments or teams.
Call codes are set by users in the Totalview client and serve to document the purpose and result of each call.
The reports are divided into three main views:
Reason Codes: How outcome codes are distributed across reason codes.
Members’ Outcome Codes: Outcome code usage per individual user.
Members’ Reason Codes: Frequency of reason code assignments by each user.
Each report page includes filtering tools like date range pickers and user selectors to narrow down and customize the data.
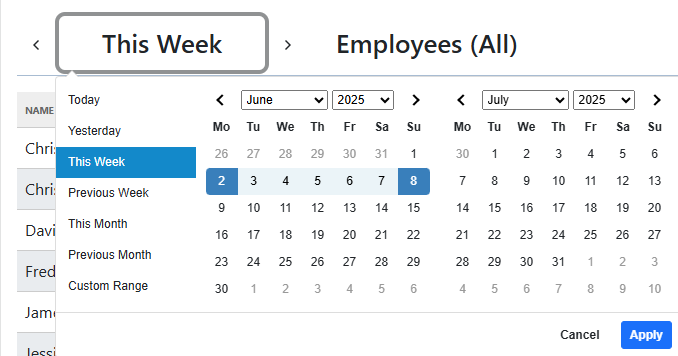
Date range picker
The date range picker determines the period for which the call code data is shown.
Users can choose from several predefined time ranges such as “Today”, “Yesterday”, “This Week”, and more.
Custom date ranges are also supported for more flexible reporting.
Additionally, users can step forward and backward in time using the currently selected range.
This allows easy navigation between time periods while keeping the same interval length.
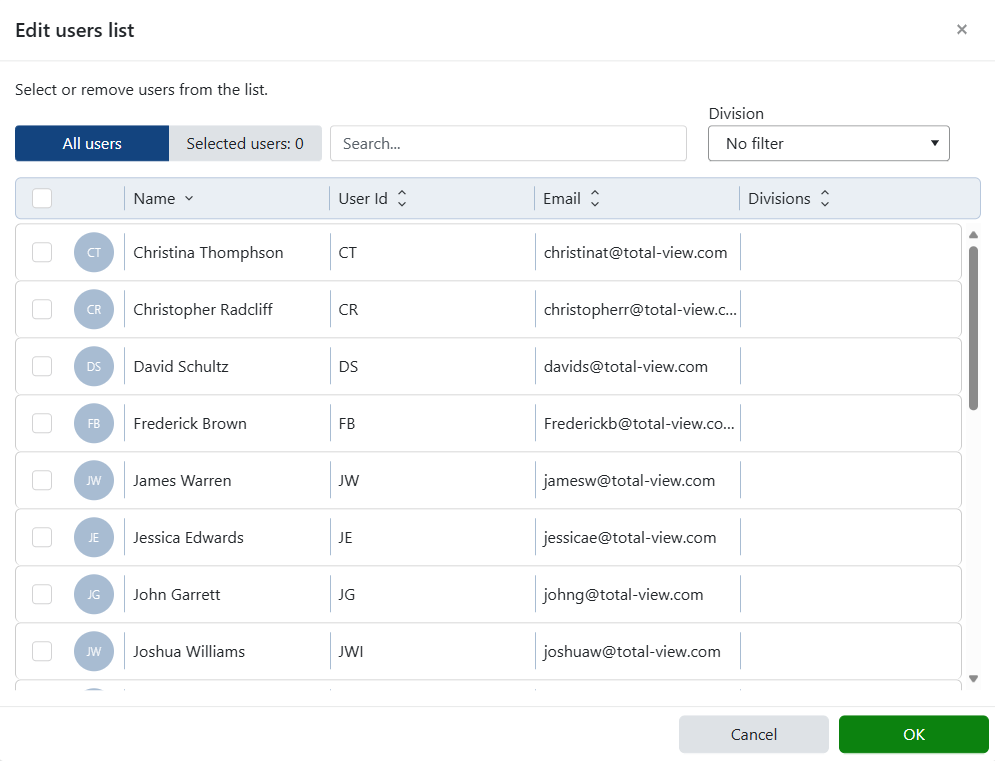
User picker
The user picker allows selection of one or more users to include in the report. The following options are available:
Specific users: Focus the report on selected individuals.
All users: Show data for every user.
No users selected: Interpreted as all users selected by default.
This flexibility supports both targeted monitoring and organization-wide overviews.
Reason codes
The Reason Codes page presents how outcome codes are distributed across different reason codes.
This allows for analysis of what outcomes are typically associated with specific call types.
There are two configurable menus:
Reason Code Menu: Select which reason codes should appear as rows in the table. Unselected codes are grouped under an “Other” row to maintain clarity without losing total counts.
Outcome Code Menu: Choose which outcome code to display in dedicated columns.

Name |
The name of the reason code |
Total Calls |
Total number of calls where this reason code was selected |
First Call Resolution |
Percentage of calls handled by a single user where the outcome was Resolved |
Average Handle Time |
Average duration of calls tagged with this reason code |
Percentage |
Proportion of total calls represented by this reason code |
Resolved |
Percentage of calls with this reason code that resulted in a Resolved outcome |
Unresolved |
Percentage with an Unresolved outcome |
Transferred |
Percentage with a Transferred outcome |
Dropped |
Percentage with a Dropped outcome |
Escalated |
Percentage with an Escalated outcome |
Neutral |
Percentage with a Neutral outcome |
Negative |
Percentage with a Negative outcome |
Members’ outcome codes
The Members’ Outcome Codes page highlights how individual users apply outcome codes for calls.
This can be useful for performance reviews, identifying training needs, or understanding workflow differences between users.
A single configuration menu is provided:
Outcome Code Menu: Select which outcome code column to show in the report table.
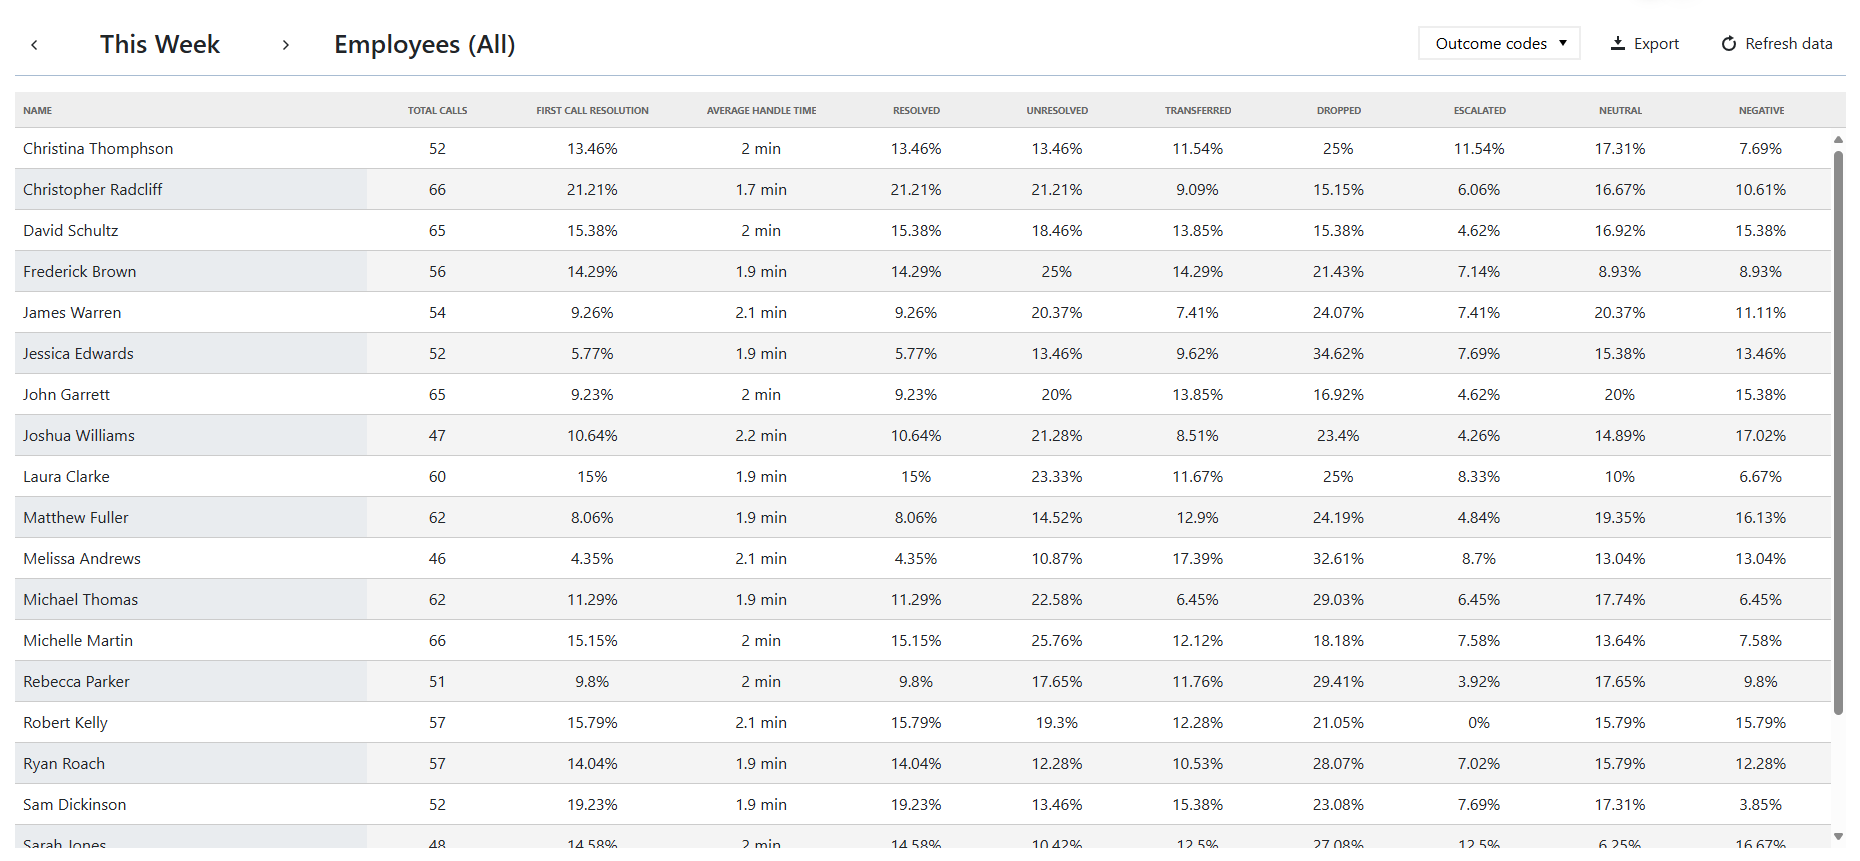
Name |
The name of the member |
Total Calls |
Total number of calls for which the user assigned call codes |
First Call Resolution |
Percentage of calls where this was the only user assigning codes and the outcome was Resolved |
Average Handle Time |
Average call duration for calls handled by this user |
Resolved |
Percentage of the user’s calls ending in a Resolved outcome |
Unresolved |
Percentage ending in Unresolved |
Transferred |
Percentage ending in Transferred |
Dropped |
Percentage ending in Dropped |
Escalated |
Percentage ending in Escalated |
Neutral |
Percentage ending in Neutral |
Negative |
Percentage ending in Negative |
Members’ reason codes
The Members’ Reason Codes page shows how frequently each user selects specific reason codes.
This view helps understand what types of calls each member typically handles and whether usage aligns with expectations.
The page includes:
Reason Code Menu: Select which reason codes to show as columns in the report table. Each code becomes a column, and the cell value indicates how many times that user selected it.

Name |
The name of the member |
Total Calls |
Number of calls where this user has assigned call codes |
First Call Resolution |
Percentage of calls handled solely by this user with a Resolved outcome |
Average Handle Time |
Average call duration for this user |
Dynamic columns |
Each selected reason code has its own column showing how many times it was selected by the user |